Compare
Rob the Brainrot vs My Solar Farm
Live players, peak concurrency, visits, favorites, rating, and estimated monthly revenue for two Roblox games, side by side.

Rob the Brainrot
36 playing · wins 1 of 7
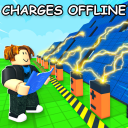
My Solar Farm
36 playing · wins 3 of 7
Concurrent players, last 30 days
Hourly peak of the sampled player counts.
- Rob the Brainrot
- My Solar Farm
Head to head
The stronger value in each row is highlighted. Revenue is an estimate; see the methodology.
| Metric | Rob the Brainrot | My Solar Farm |
|---|---|---|
| Live players | 36 | 36 |
| Peak (30d) | 36 | 91 |
| Total visits | 45.2M | 20.2M |
| Favorites | 13.8K | 1.1M |
| Rating | 72.4% | 97.7% |
| Est. revenue / mo | $130–$648 | $130–$648 |
| Access price | Free | Free |
Track Rob the Brainrot and My Solar Farm
Watch both games and get alerted when either changes its icon, price, or name, or ships an update.